

In August 2025 we put a paper to our advisory board setting out what we thought of Australia's major banks. Its first line was that, apart from ANZ, bank multiples were extended against four different yardsticks at once: their own history, global peers, the growth consensus expected of them, and the returns they earn on capital.
At the time we still owned two of the four. We own none of them now.
More than a year on, that view is worth revisiting.
What it would cost the index
If the four major banks traded tomorrow on their own twenty-year median multiples, and nothing else in the market changed, the S&P/ASX 200 would be about 7% lower.

That is arithmetic rather than a forecast. The four banks are 23.3% of the index between them. Commonwealth Bank alone is 9.7%, and it would have to fall 39% to trade where it has typically traded; the other three between 23% and 25%. Multiply each fall by its weight in the index and the four together take 7.0 percentage points off it, of which Commonwealth Bank is 3.8.
Nothing says that has to happen. A multiple can sit above its own history for years, and these have. The number is not a prediction. It is the size of the gap between what the banks cost and what they have normally cost, put in the one unit every Australian investor already owns.
What the paper actually argued
We value banks the way we value anything else: on the cash a business can be expected to generate through a full cycle, not on the earnings it reports in a good year. For banks that means three adjustments. Cash conversion, because capital intensity has improved but moves with the cycle, the regulator has raised the capital banks must hold, and a good deal of software spending is capitalised and later written off. Growth, where we make no adjustment but do note that Commonwealth Bank's revenue grew only 2.1% a year over the decade to 2026, half the pace of its loan book (3.3% a year excluding the wealth and insurance businesses it has since sold), and that three of the four majors pay a lower dividend per share than ten years ago: Westpac 18% less, National Australia Bank 14% and ANZ 8%, while Commonwealth Bank's has risen below inflation at only 1.9% a year. And risk, because a bank is a leveraged institution and a recession has to be in the arithmetic somewhere rather than assumed away.
What came out of that was not a view that the banks are bad businesses. It was a view that their share prices already assumed a great deal.
Why expensive can stay expensive
Our advisory board exists so that people who are not us can tell us where we are wrong. Its members have run mining companies, investment teams and audit practices. Papers go to it before a view hardens, not afterwards.
At the August 2025 meeting we were joined by an investor who runs a large Australian equities mandate. He did not disagree with the paper. He said something more interesting: that he largely agreed the banks were expensive and unlikely to be good investments on a five-year view, and that it made very little difference to what he could do about it. New money keeps arriving and has to be invested. The banks are a large part of the index. Deviating far from the index risks a period of underperformance against peers, and under the performance test the industry now faces, that is a risk his business cannot afford to take.
It is the strongest available explanation for why an expensive asset can stay expensive for a long time — a large, price-insensitive and growing buyer, who knows the price is high and buys anyway. It is also the reason we think the opportunity is real rather than imaginary. Our competitive position is not that we are cleverer about bank margins. It is that we are able to not own something.
What we did, and what the shares did
We had been reducing Westpac through 2025 and finished selling it in December. ANZ, the paper's exception, we kept as a real position until February 2026. Commonwealth Bank, the largest company in the index, we have not owned in any size since the paper. Since February we have owned none of the four.
So we did not simply sit out the sector. A view was written down, argued with, and then acted on over about six months.
Since the paper was written, ANZ has returned 34% including dividends, Westpac 10%, National Australia Bank 7%, and Commonwealth Bank −7%, against 6% for the S&P/ASX 200. Over 2026 so far the four are roughly flat against a market up about 5%.
We are deliberately not converting that into a claim about our own returns: choosing windows is how performance claims flatter the people making them. Our actual performance, net of fees and over standard periods, is published every month.
Where the banks trade today
On consensus forward earnings — the price today divided by what analysts expect the company to earn next year — three things in that picture matter.
Every one of them is still well above its own twenty-year median. Whatever else has changed, the observation we made in August 2025 has not stopped being true.
Three of the four are cheaper than they were. Commonwealth Bank has come from about 26 times to 22.5. That de-rating is, more or less, the negative return: not much happened to the business, the market simply agreed to pay less for it. The same is true in smaller measure of National Australia Bank and Westpac.
And ANZ's multiple has not moved at all — 14.8 times then, 14.9 times now. Its 34% return came from earnings, not from investors paying more for them. It is also a fair challenge to our own paper. On this measure ANZ was never the cheap one: 14.8 times in August 2025 was already close to the top of its twenty-year range, as it is today. Our "apart from ANZ" rested on our own valuation work and on how ANZ compared with the other banks, not on how it compared with its own history. Looked at this way we were more generous to ANZ than its own record justified — and ANZ was the one major we actually owned. We would rather print that than leave it out.
A longer view is worth one more picture, because two dots cannot show when anything happened.
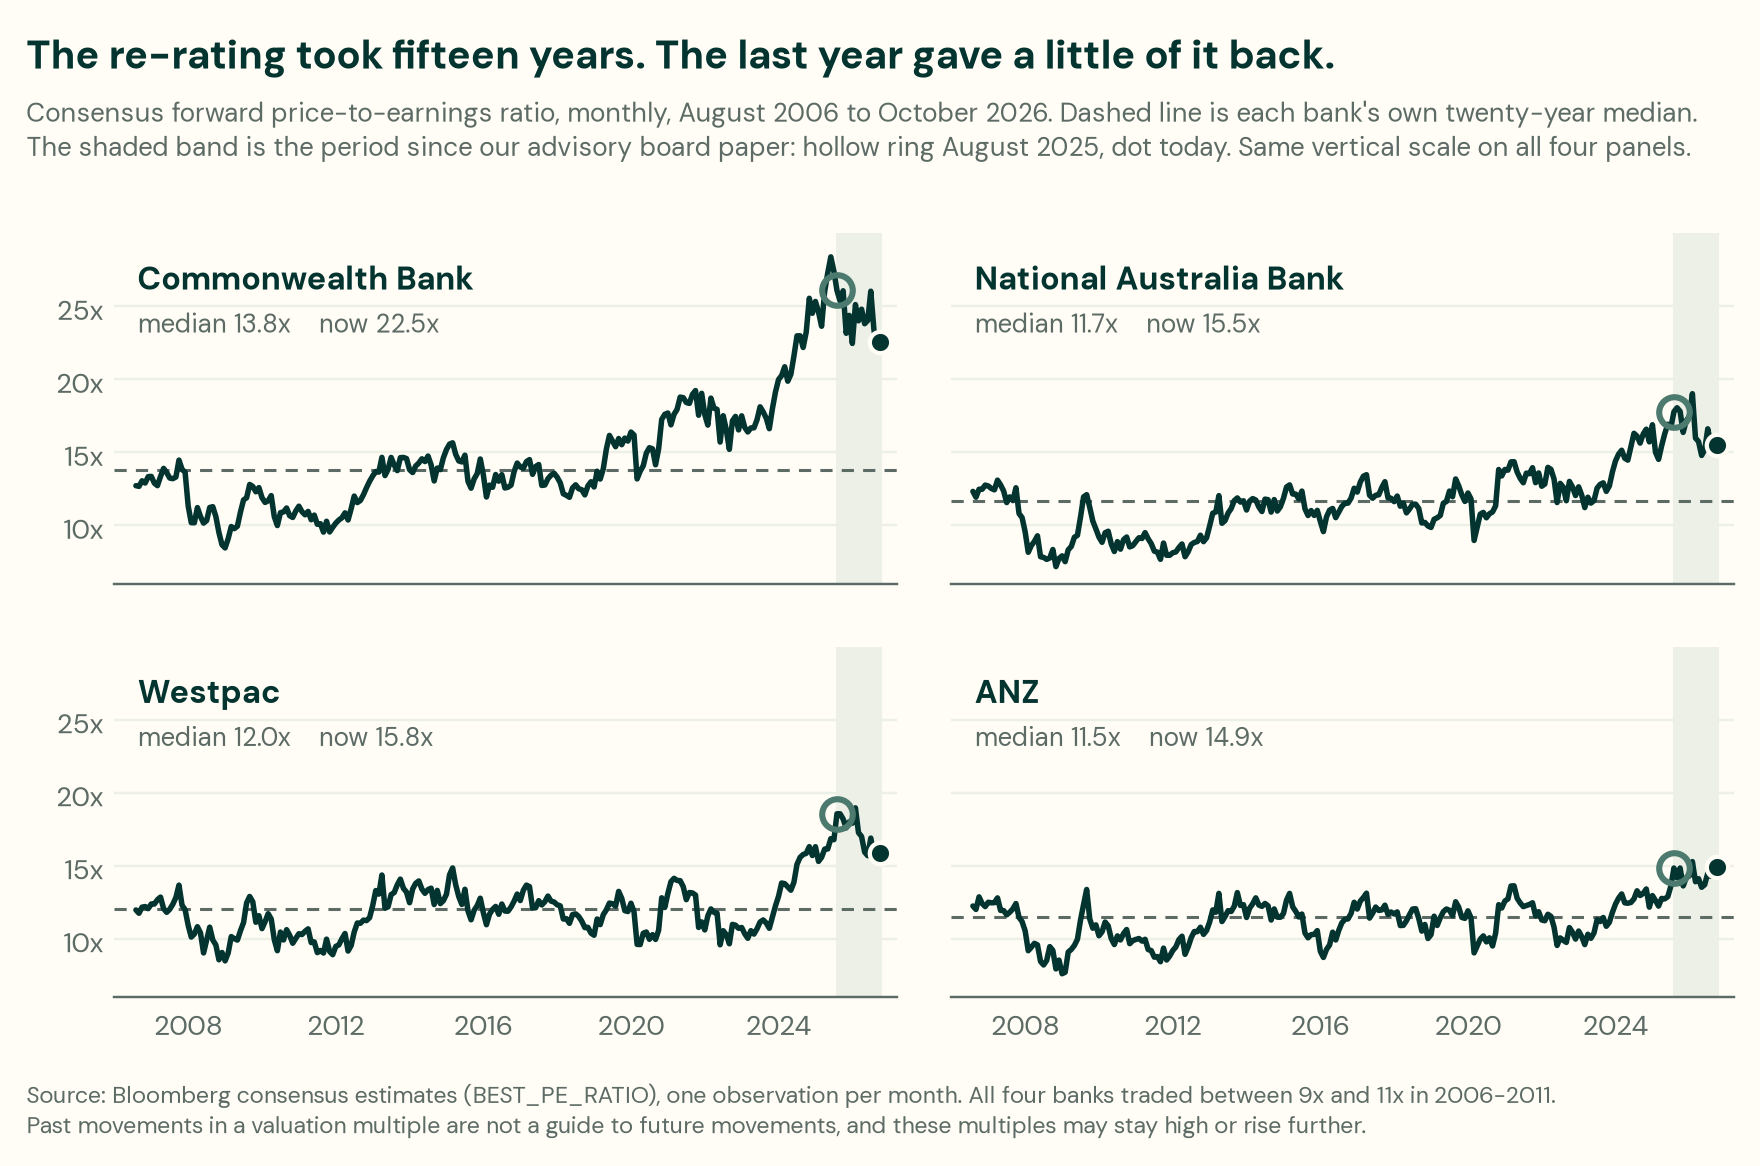
The re-rating is not a recent event. Through 2006 to 2011 all four banks traded between about nine and eleven times forward earnings. Most of the drift upwards happened long before we wrote the paper, and the last year has given back only a little of it.
What they actually earn
A multiple is only half the question. The other half is what is being multiplied.

Indexed to 2006, the median company in today's index is expected to earn about 70% more per share than it was twenty years ago. ANZ is up 17%, Westpac 11%, and National Australia Bank is down: the market expects it to earn less per share next year than it expected of it in 2006. Only Commonwealth Bank, up 93%, has kept pace with the middle of the market.
None of those figures is adjusted for inflation, so every one of them overstates what a shareholder really gained.
A second caveat: the market line can only be drawn from companies that are in the index today and were already listed and profitable in 2006 — 92 of the 200 — so it leaves out both newer arrivals and anything that has since dropped out. Companies drop out of an index mostly by doing badly, so the exclusion flatters the market and therefore widens the gap in our favour. Treat it as the generous version of our own argument rather than the careful one.
Per share is not the whole story
Earnings per share is profit divided by the number of shares, and the number of shares has not held still. The banks raised a great deal of equity during the financial crisis and have issued more ever since through dividend reinvestment plans, while Commonwealth Bank has been buying its own stock back. So the chart above measures what a shareholder owns a claim on — which is the right test for a price-to-earnings ratio — but it does not say whether the businesses themselves grew.
This one does.

Measured in profit rather than per share, every one of the four has grown — Commonwealth Bank by about 145%, Westpac 106%, ANZ 90%, National Australia Bank 66%. The businesses did get bigger. Westpac and National Australia Bank have issued far more shares since 2006 than Commonwealth Bank has. Some of that growth was bought with shareholders' own money.
But the comparison does not get better for the banks — it gets worse. The median company in the index grew its profit by about 233% over the same twenty years, more than any of the four. On the per-share measure Commonwealth Bank at least kept pace with the middle of the market. On profit, none of them did.
That combination is what we have found hard to defend: a multiple near the top of its twenty-year range on profits that have grown more slowly than the market's for two decades.
We are not alone in thinking the sector remains dear. Several sell-side brokers have argued this year that the Australian majors trade at a premium to comparable banks offshore — about a third above what global relationships would imply, on one house's estimate.
The case against us
Here is the other side, some of it from the paper itself.
Retail returns may improve and business and institutional returns may stay higher than history suggests. The banks may cut costs and keep the benefit rather than competing it away. The loan books really may be structurally less risky than they were, and that may not have been passed to customers either. The regulator may relax capital requirements. Any of those would justify a higher multiple than we think is deserved, and we have been wrong about similar things before.
There is also a serious argument from the other direction on the global comparison: that rather than Australian banks being too expensive, international bank multiples have been rising towards ours, and the long-held view that our banks trade at an unjustifiable premium is the thing that is about to flip. We do not believe it, but it is made by thoughtful people with the same data, and we may be wrong.
And the visitor's point cuts at us too. If the largest buyers in the market are structurally obliged to keep buying regardless of price, an expensive asset can stay expensive for longer than a patient investor finds comfortable. Being right eventually is only useful if you are still there.
Where we are today
Of the banks, we own only Judo, a much smaller lender to small and medium-sized businesses, which we bought recently and hold for reasons specific to it rather than as a view about banks in general.
The charts above say why we are content to hold none of the four, and they say it in two different ways. The first pair is about price: every one of the four trades near the top of its own twenty-year range, and the one that used to be the exception no longer is. The second pair is about what you are buying: profits that, for all four, have grown more slowly than the median company in the index for twenty years.
Holding none of them is a large deviation from the index and it is deliberate. It is also precisely the position our visitor explained he was not free to take. We think that freedom is the whole opportunity: we are being paid to accept a risk he cannot, which is the risk of looking wrong for a while. We would rather explain that to you now than after it has or has not worked.
