News & Insights

Same equity risk, twice the franking

Same equity risk, twice the franking

A retirement portfolio is about half growth assets and half defensive. That is roughly where Australia's large funds put a 65-year-old, and it is what the Vanguard Balanced Index Fund — a reasonable proxy for the shape — targets exactly.

Inside the growth half, one slice does something none of the others can. Australian shares pay franking credits, and for a retiree in pension phase those credits come back as cash.

Why this matters more after retirement than before it

Franking credits are refundable. A superannuation fund in pension phase pays no tax, so every credit it receives is paid out to it in full. The foreign tax withheld inside an international equity fund is not refundable: the offset can reduce an Australian tax bill to zero, but it cannot create a refund, and any excess is simply lost.

So for the investor this article is about, the Australian slice of the growth half earns something the rest of the portfolio cannot. The rest quietly pays tax it will never see again.

Collecting franking on more than you own

Here is the part that is not obvious. A fund that hedges part of its equity exposure still owns the shares underneath the hedge — and those shares still pay dividends, and those dividends still carry credits.

Our own Australian Share Income Fund typically runs 60–80% net long, hedging the rest with options. At 70%, holding 28.6% of a portfolio in it gives 20% look-through Australian equity — exactly what the Balanced fund holds — plus an 8.6% sleeve that behaves like cash. Because that sleeve is cash-like, it is funded from the defensive side rather than the growth side.

The result is a portfolio with identical growth exposure that collects franking on 29% of itself rather than 20%.
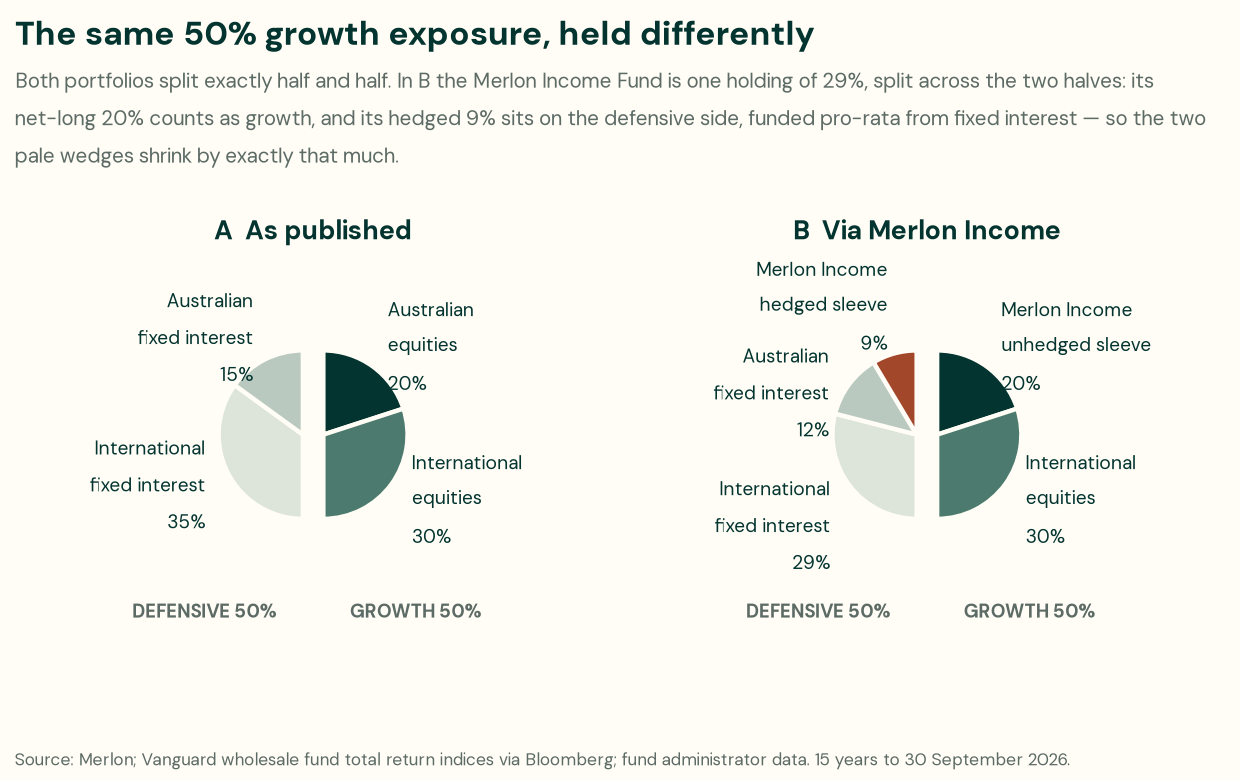
Two allocations drawn as semicircle pairs, defensive on the left and growth on the right, separated by a vertical gap. Portfolio A, the Vanguard Balanced Index Fund as published: growth is Australian equities 20% and international equities 30%; defensive is Australian fixed interest 15% and international fixed interest 35%. Portfolio B: growth is the Merlon Income Fund's unhedged sleeve 20% and international equities 30%; defensive is the Merlon Income Fund's hedged sleeve 9%, Australian fixed interest 12% and international fixed interest 29%. Both halves are exactly 50%. Source: Merlon, Vanguard wholesale fund total return indices via Bloomberg, fund administrator data, 15 years to 30 September 2026.

What that was worth, over fifteen years

Change nothing else — same international equities, same fixed interest, rebalanced monthly.
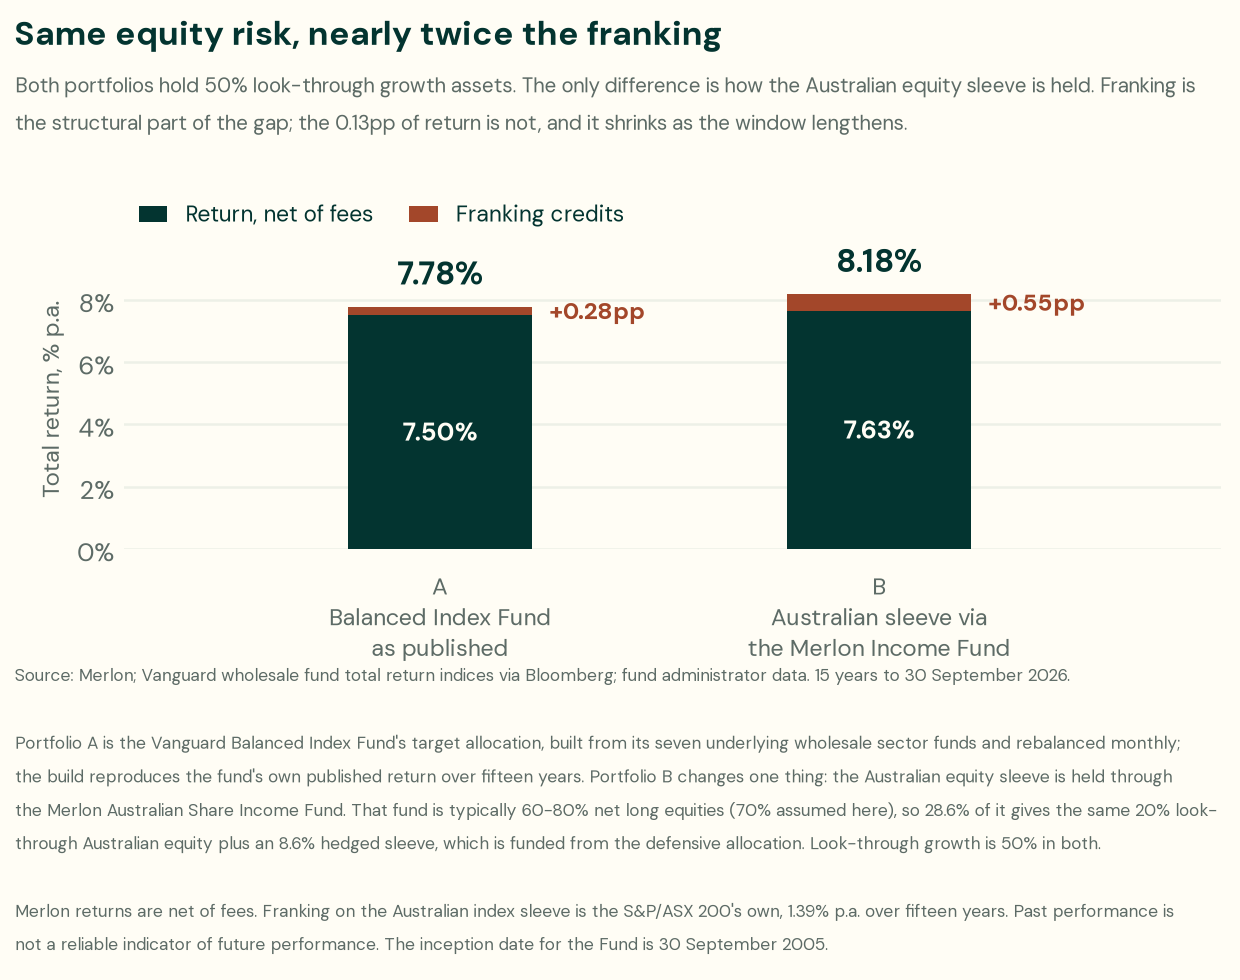
Stacked bar chart titled 'Same equity risk, nearly twice the franking'. Portfolio A returns 7.50% plus 0.28 percentage points of franking credits, totalling 7.78% a year. Portfolio B returns 7.63% plus 0.55 percentage points of franking, totalling 8.18%. Fifteen years to 30 September 2026. The chart carries the method and the standard performance footnotes, including that past performance is not a reliable indicator of future performance and that the Fund's inception date is 30 September 2005.

Franking roughly doubles, from 0.28 to 0.55 percentage points a year, on identical equity exposure. The income the portfolio pays out rises too — from 4.29% to 4.85% grossed up, which on a $500,000 balance is about $2,800 a year more to actually spend.

Stacked bar chart titled 'What a retiree can actually draw'. Portfolio A pays cash distributions of 4.01% plus 0.28 percentage points of franking, 4.29% grossed up. Portfolio B pays 4.30% plus 0.55 points of franking, 4.85% grossed up. Fifteen years to 30 September 2026, with the standard performance footnotes.

The fifteen years were not a neutral test

This is the part that matters more than the result, so we would rather put it plainly than bury it.

International equities returned 13.9% a year over this period against Australian equities' 9.6%. That is an extraordinary gap, driven largely by a handful of very large US companies, and it is a headwind to anything tilted towards Australia. Our comparison survives it because it does not tilt — both portfolios hold the same 20% — but a reader should know which way the wind was blowing.

And bonds did badly, which is the opposite of what most people assume. The Australian 10-year yield rose from 4.22% to 5.12% across the window. Fixed interest returned about half what it now yields; so did cash.
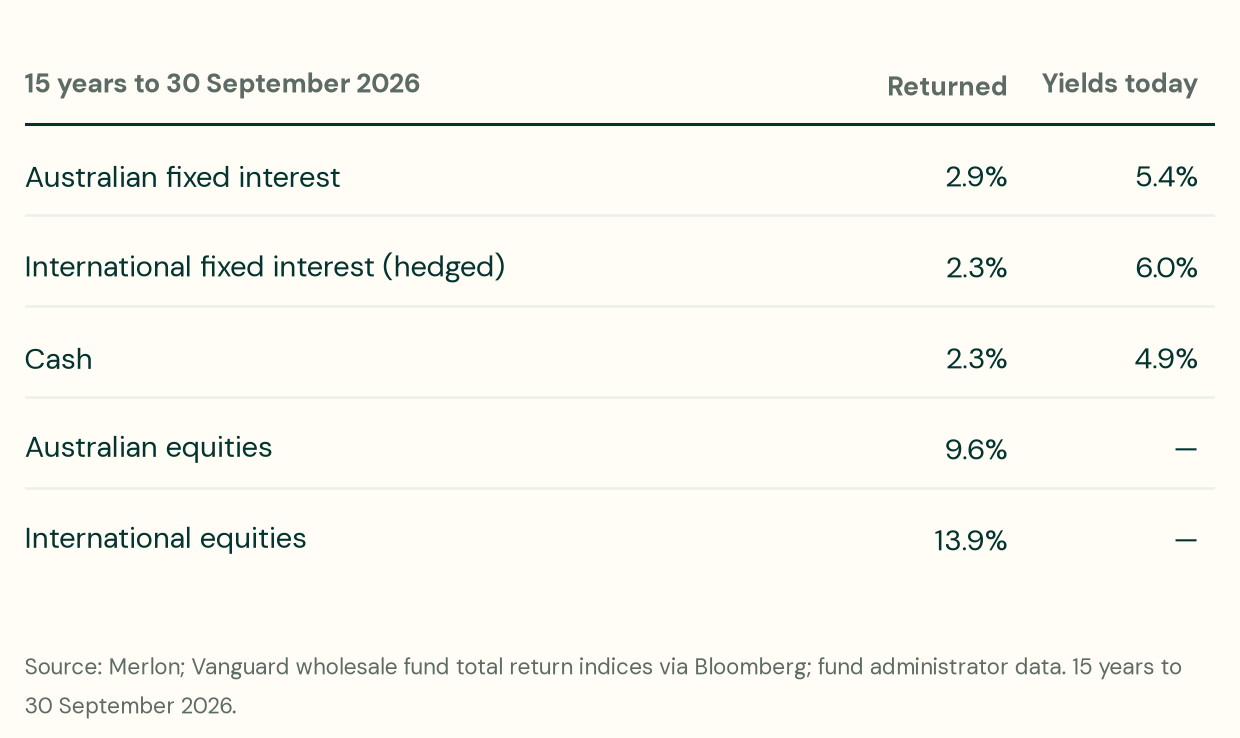
Table, fifteen years to 30 September 2026, of what each asset class returned a year and what it yields today. Australian fixed interest returned 2.9% a year and yields 5.4% today; international fixed interest (hedged) returned 2.3% and yields 6.0%; cash returned 2.3% and yields 4.9%; Australian equities returned 9.6% and international equities 13.9%, neither of which is quoted as a yield. Source: Merlon; Vanguard wholesale fund total return indices via Bloomberg; fund administrator data.

Nobody knows the next fifteen. But the arithmetic is suggestive

We are not forecasting. What we can do is apply the same assumption to both equity markets and see what falls out.

Give Australian and international equities an identical risk premium over their own bond markets. The gap between them is then just the gap between those bond markets — 0.6 percentage points, against the 4.3 points international actually delivered. That conclusion holds whatever premium you choose, because it is the same number added to both. Franking adds 1.4 points to the Australian line for an investor who can use it, which more than covers the 0.6.

Two things follow, and neither depends on us being right about markets. If bonds return closer to their yields, the defensive half does better in both portfolios — and the hedged sleeve, being cash-like, does better alongside them. And if international returns land closer to Australian ones, the cost of holding Australian equities falls while the franking they pay does not.

In other words, the case for the hedged sleeve, and for an Australian tilt more broadly, looks better in a normal world than it did in this one.

What this does not mean

Our fund trailed the index. Over the same fifteen years the Income fund returned 7.96% a year net of fees against the Australian index fund's 9.62%. The portfolio still comes out ahead because of franking and because the hedged sleeve displaced bonds that returned almost nothing — not because of stock selection.

And the Australian index is concentrated, which is a reason to think about how an Australian tilt is held, not only how large it is. Merlon's portfolios are built without reference to index weights; that is a separate argument for another piece.

For the record, and because a five-year figure is the one that should be quoted: the Merlon Australian Share Income Fund returned 10.55% a year over the five years to 30 September 2026, and 8.98% a year excluding franking credits. Past performance is not a reliable indicator of future performance.

The lesson, which is not about us

Most of the attention in a retirement portfolio goes to how much sits in growth assets. The more useful question, once that is settled, is what the growth half is made of — because one part of it pays a credit that comes back as cash, and the rest pays tax that never does.

Author: Jack Dooley/Client Relationship Manager

This article has been prepared by Merlon Capital Partners Pty Limited (ABN 94 140 833 683, AFSL 343 753) (Merlon).

The advice contained in this article is general advice. It has been prepared without taking account of your objectives, financial situation or needs and because of that, you should, before acting on the advice, consider the appropriateness of the advice, having regard to your personal circumstances. You should also consult a licensed financial adviser before making an investment decision.

Fidante Partners Limited ABN (94 002 835 592 AFSL 234668) (Fidante), a member of the Challenger Limited group of companies (Challenger Group), is the Responsible Entity of the Merlon Concentrated Australian Share Fund (ARSN 617 082 238) and The Merlon Australian Share Income Fund (ARSN 090 578 171) (the Funds). Merlon Capital Partners Pty Ltd has been appointed as the investment manager of the Funds. Other than information which is identified as sourced from Fidante in relation to the Funds, Fidante is not responsible for the information in this article, including any statements of opinion.

Any investment in the Funds needs to be made in accordance with the respective Product Disclosure Statement (PDS), Additional Information Booklet and Target Market Determination (TMD). Investors should consider the PDS, Additional Information Booklet and TMD before deciding whether to invest in the Funds or continue to hold units in the Funds. Applications for units in the Funds can only be made pursuant to the application form relevant to the Funds. Distributors of the Funds must consider the TMD. You can access the relevant PDS, Additional Information Booklet and TMD at the Merlon website: https://www.merloncapital.com.au/

Investments in the Funds are subject to investment risk, including possible delays in repayment and loss of income or principal invested. Please note that investments are subject to market and other risks and there is no assurance or guarantee that the intended investment objectives will be achieved. An investment's current performance may be lower or higher than the investment performance noted within the article.

Any projections contained in this article are estimates only. Such projections are subject to market influences and contingent upon matters outside of our control and therefore may not be realised in the future.

Past performance is not a reliable indicator of future performance. Any reference to past performance in this article is intended to be for general illustrative purposes only and should not be relied upon.

The information in this article is up-to-date as at the time of preparation. However, some information and terms may change from time to time. While we believe the information contained in this article is based on reliable information, no representation or warranty, express or implied, is made as to its accuracy or completeness. While every care has been taken in the preparation of this material, to the fullest extent permitted by law, Merlon, its respective officers, directors, employees or agents, disclaim any and all liabilities for any loss or damage (including consequential loss or damage) howsoever arising in connection with the use of this contents.

Definition of success

“Success is a culture of integrity, passion and purpose. Deep client trust. Investment outcomes
worth the trust. A business built to outlast us.”

Stay close to the thinking.Insights from the Merlon team — delivered occasionally, not constantly.

Thank you! Your submission has been received!
Oops! Something went wrong while submitting the form.