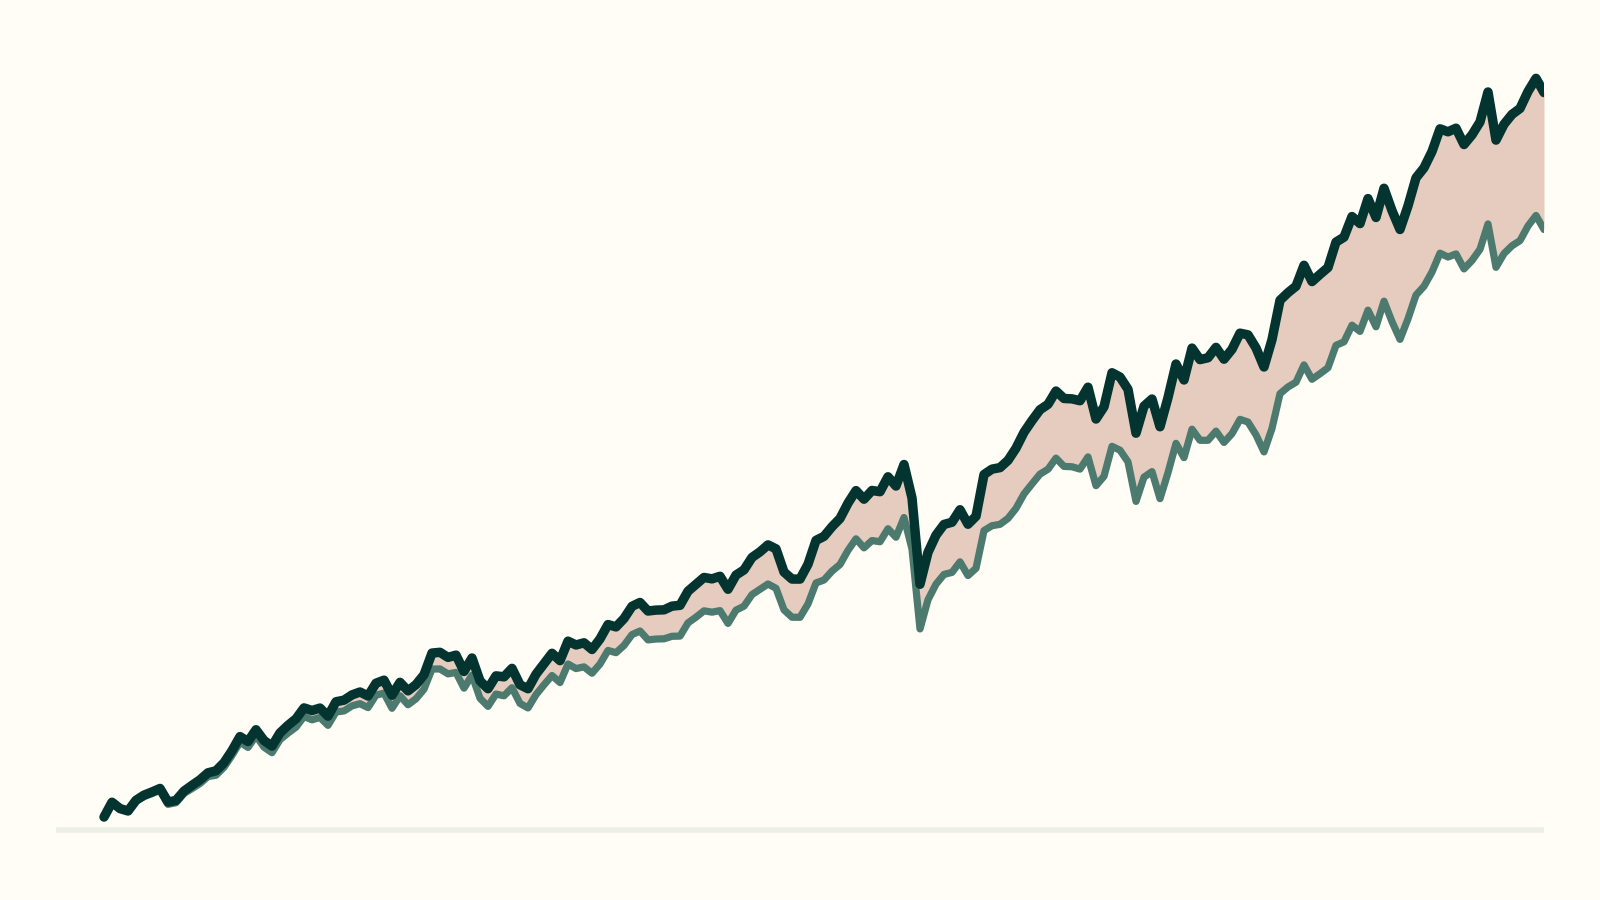

Over the fifteen years to 30 September 2026 the Australian sharemarket returned 9.75% a year. It also returned 11.14% a year. Both figures are correct, the difference between them is franking, and which one you are shown depends entirely on whose table you happen to be reading.
That gap — 1.39 percentage points a year, every year, for fifteen years — is larger than the fee on most actively managed funds. It is larger than the difference advisers spend a good deal of time debating when they compare one manager with another. And in most performance tables it does not appear at all.
What franking is, in one paragraph
An Australian company pays tax on its profits before it pays a dividend. When it passes the dividend on, it attaches a credit for the tax already paid, so the same profit is not taxed twice. For a shareholder on a lower tax rate than the company, that credit is worth real money: for a superannuation fund in pension phase, which pays no tax, it comes back as cash. It is not a theoretical adjustment and it is not a quirk of presentation. It is part of what the investment paid you.
Where franking comes from inside a portfolio
Here is the part that gets missed. A portfolio only earns franking on the part of it that is invested in Australian shares. Everything else — cash, bank bills, term deposits, most fixed income — earns none at all.
So consider the most common way an adviser builds a defensive Australian equity allocation: a blend, something like 70% in the sharemarket and 30% in bank bills. That blend is less volatile than the market, which is the point of it. It also earns less franking than the market, which is usually nobody's point at all.

The blend collects roughly seven-tenths of the market's franking, and it does so in every period on that chart — one year, three, five, seven, ten and fifteen. That consistency is not a coincidence and it is not an argument. It is the equity weight, showing up in the credit: about thirty per cent of the portfolio is in something that earns no franking, so about thirty per cent of the franking is not there.
Over fifteen years that is 0.98 points a year against the market's 1.39 — roughly four-tenths of a point surrendered before the manager has done anything at all, good or bad.
And the decision is almost never made in those terms. An adviser choosing a blend is making a considered judgement about risk: less exposure to the sharemarket, less of a fall when it falls. That is a perfectly good judgement. The franking consequence simply rides along behind it, unpriced, because the table being used to make the comparison does not have a column for it.
Why it goes unnoticed
There is a practical reason this sits outside most conversations, and it is not that advisers do not care about franking.
From our discussions with financial planners over many years, our understanding is that a good deal of platform and reporting software makes it difficult to see which particular investments generated the franking credits a client received. The credits are captured, and they do reach the client — but they tend to be reported at the portfolio level, as one annual figure, rather than attributed back to the holdings that produced them.
That has two consequences worth drawing out. The first is that the credits turn up months after the decision that earned them, in a tax statement, detached from the investment that generated them — so a manager earning well above the market's franking and a manager earning well below it look the same in the reporting an adviser uses to compare them. The second is more awkward: the comparison that drives the selection is made on numbers that exclude franking, while the client's actual outcome includes it. The decision and the result are being measured in different currencies.
None of which is anybody's fault in particular. It is an artefact of how the data flows, and it is the reason a difference worth more than a fee can sit in plain sight without entering the conversation. The practical answer is not to re-engineer the platform. It is to ask, when two things are being compared, whether franking is in both numbers or neither.
There is more than one way to be defensive
The reason that matters is that holding less of the sharemarket is not the only way to take less risk in it.
Our own Australian Share Income Fund is an example, and we should be plain that it is ours. It reduces exposure to sharemarket volatility to a typical range of 60–80% through the use of derivatives, with the remaining 20–40% option protection seeking to deliver a cash-like risk/return profile. That is a similar destination to the blend — part of the portfolio behaving something like cash — reached a different way. The shares themselves are still held, so the franking they generate is still collected.
One disclosure before the numbers, because this article is about reporting basis and it would be poor form to skip it. The fund's benchmark has been the 70/30 composite since 16 May 2022, and before that it was the S&P/ASX 200 Accumulation Index. The comparison below applies the current benchmark to every period, which is what the fact sheet does and what the administrator reports — but for most of a fifteen-year window the fund was measured against something else, and the figures later in this article show it behind that something else.
You can see the result in the green bars above. The fund has earned 1.75 points of franking a year over fifteen years, against 1.39 for the market and 0.98 for the blend. On that one measure it has collected close to twice what the blend did.
Which is enough to change the answer
Over the longer periods, the franking difference is bigger than the performance difference it sits inside. At ten years the fund has earned 0.68 points a year more franking than its benchmark, against a performance margin of −0.23 before franking is counted; at fifteen years, 0.77 points against +0.22. The smaller number is the one the table usually shows.
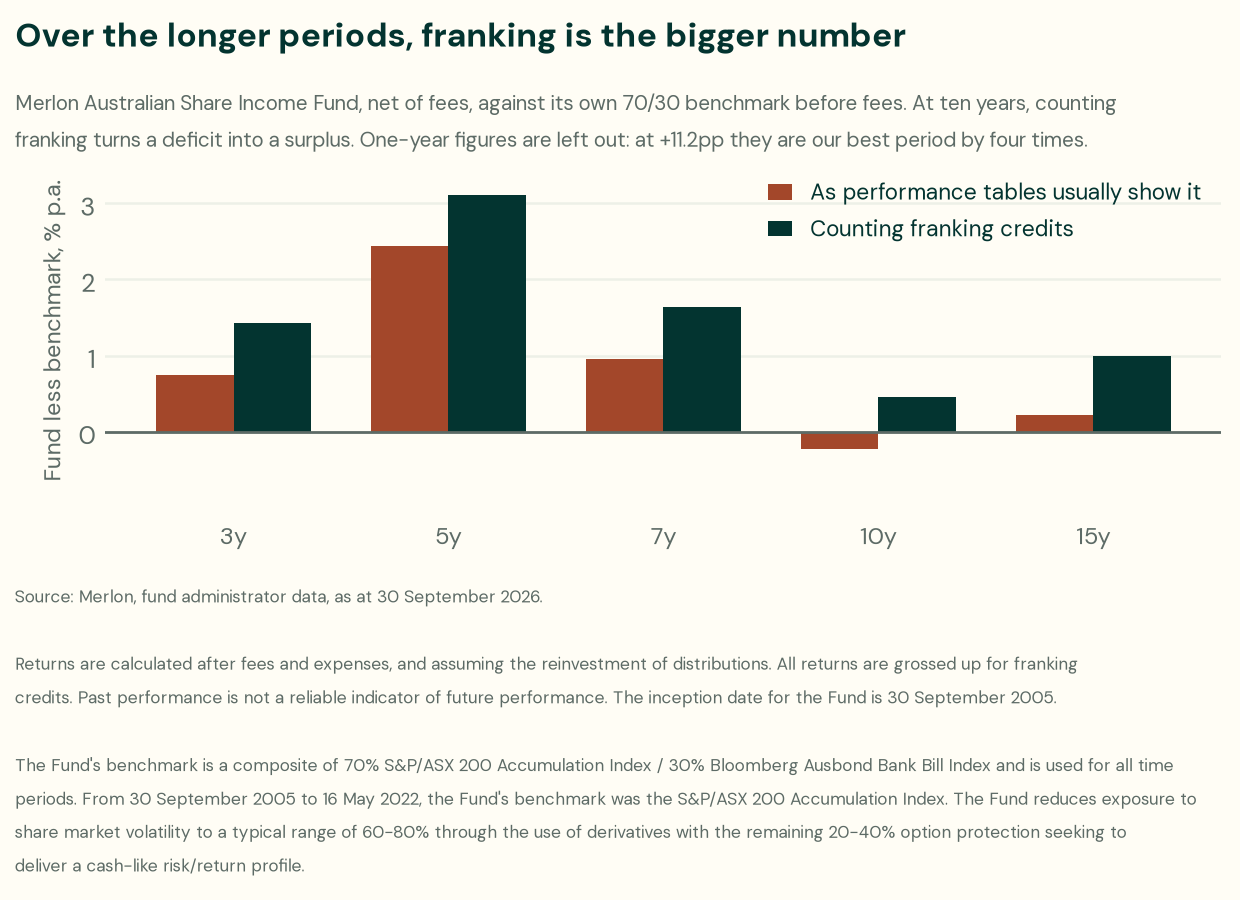
At ten years that is enough to change the sign: measured the way performance tables usually measure, net of our fees, the fund has trailed its benchmark by 0.23 points a year; counting franking on both sides it is ahead by 0.45. Same fund, same benchmark, same period, opposite conclusion — and the line that decides it is the one most tables leave out. Over the other periods franking does not change who is ahead. It changes the margin by roughly three-quarters of a point a year, which is enough to matter to the comparison even when it does not reverse it.
For the record, and because a five-year figure is the one that should be quoted: the Merlon Australian Share Income Fund returned 10.55% a year over the five years to 30 September 2026, and 8.98% a year excluding franking credits. Past performance is not a reliable indicator of future performance. The full performance footnotes are under each chart above; benchmark figures throughout are before fees, which flatters the benchmark rather than us.
One note on the windows. Nothing here runs past fifteen years, although the fund's own record does. Merlon has operated as an independent business only since 2010, and longer periods take in a predecessor fund managed inside a larger organisation — the same portfolio manager, without the dedicated research team that is most of what the firm now is. Presenting that as this firm's twenty-year record would be two different things in one column.
What this does not mean
Four things, and we would rather state them than have them put to us.
Franking is only worth its face value to an investor who can use it. A pension-phase superannuation fund gets the credits back in cash. A company, most foreign investors, and anyone whose tax rate is above the company rate do not get the same benefit, or any. If the credits are worth little to your client, most of this article is worth little to your client, and the right comparison for them is the one without franking.
A blend does something an overlay does not. Thirty per cent in bank bills does not fall when the sharemarket falls; an option position behaves differently, and in a sharp enough move it behaves differently again. These are two genuinely different ways of being defensive, and franking is one consideration among several rather than the deciding one.
Our higher franking is partly a style. A portfolio that earns more franking than the market is, among other things, a portfolio holding higher-yielding Australian companies. That is a deliberate tilt with its own risks, and it will not always be the right place to be.
And we have compared ourselves to our own benchmark, not to the sharemarket. That distinction is doing real work, so here is the other number. Net of our fees, with franking counted on both sides, the fund is behind the S&P/ASX 200 over three, seven, ten and fifteen years — by between 0.07 and 1.77 points a year — and ahead over one and five. We use the 70/30 because it is the fund's mandate and because it is what an adviser weighing a defensive allocation is actually choosing between, not because it is the kinder comparison. On the evidence above it plainly is the kinder comparison, and you should know that when you read the rest.
The lesson, which is not about us
Franking is worth more than the fee differences most comparisons are built around, and it is distributed unevenly across the things a portfolio can hold. A table that leaves it out is not neutral: it systematically understates whatever is most invested in Australian shares, and over fifteen years it has done so by about 1.4 points a year.
So whatever you conclude about any particular fund — including ours — the useful habit is narrower than any of it. When you put two options side by side, check whether franking is on both sides of the comparison. If it is on neither, you are at least comparing like with like. If it is on one and not the other, the table has already decided the answer for you.
