
David Jones went into administration last Thursday. Twelve years ago it was sold for $2.1 billion. The chief financial officer who helped get that done now sits on Merlon's Advisory Board.
Last Thursday, after 188 years, David Jones was placed in voluntary administration. Thirty-eight stores and several thousand jobs now sit with the administrators. It is a bad week for a lot of people, and nothing that follows should be read as enjoying it.
But it is also the end of a story. It started with one of the best capital allocation decisions made by an Australian listed company this century, and that is worth writing down.
The job nobody is trained for
One of the most important things a chief executive or chief financial officer does is allocate capital — decide what to buy, what to sell, what to build and what to hand back. Yet very few are trained for it. They rise through operations, or marketing, or accounting. Then one day they are asked to make a decision worth more than every operating decision they have ever made combined.
Poor capital allocation is one of the most frustrating parts of being a patient, contrarian investor. We do detailed due diligence. We examine the underlying cash flows a business actually generates, rather than the elaborately contrived measures of performance advertised by some managements and boards. We do not subscribe to the greater fool theory. That work is what lets us hold an investment for years while others are fearful, short-term, or simply unwilling to depart from popular opinion.
It is disillusioning when all of it is tossed aside by a board that becomes fixated on the latest growth story or management fad. It happens through an over-priced acquisition, an inopportune divestment at an under-price, or a recommendation that shareholders sell out to an opportunistic bidder at a depressed price.
So it is worth being just as explicit about what the opposite looks like.
David Jones — a case study
In 2014, following an unsolicited offer of $4.00 per share, the David Jones board had three options.
- Accept the Woolworths offer. Sell the company to Woolworths Holdings of South Africa for $4.00 per share in cash, valuing David Jones at approximately $2,149 million — around $3.0 billion in today's money.
- Pursue the Myer proposal. Re-engage with Myer over its earlier merger-of-equals proposal, under which David Jones shareholders would receive 1.06 Myer shares for each David Jones share. At the time the proposal was put to David Jones, this represented a value of approximately $2.62 per share.
- Remain independent. Continue operating as a standalone listed company, which the market had valued at $2.87 per share in January 2014, before takeover speculation affected the share price.
The board recommended the Woolworths cash offer — a 39% premium to the undisturbed market value of David Jones, and half as much again as the Myer scrip.
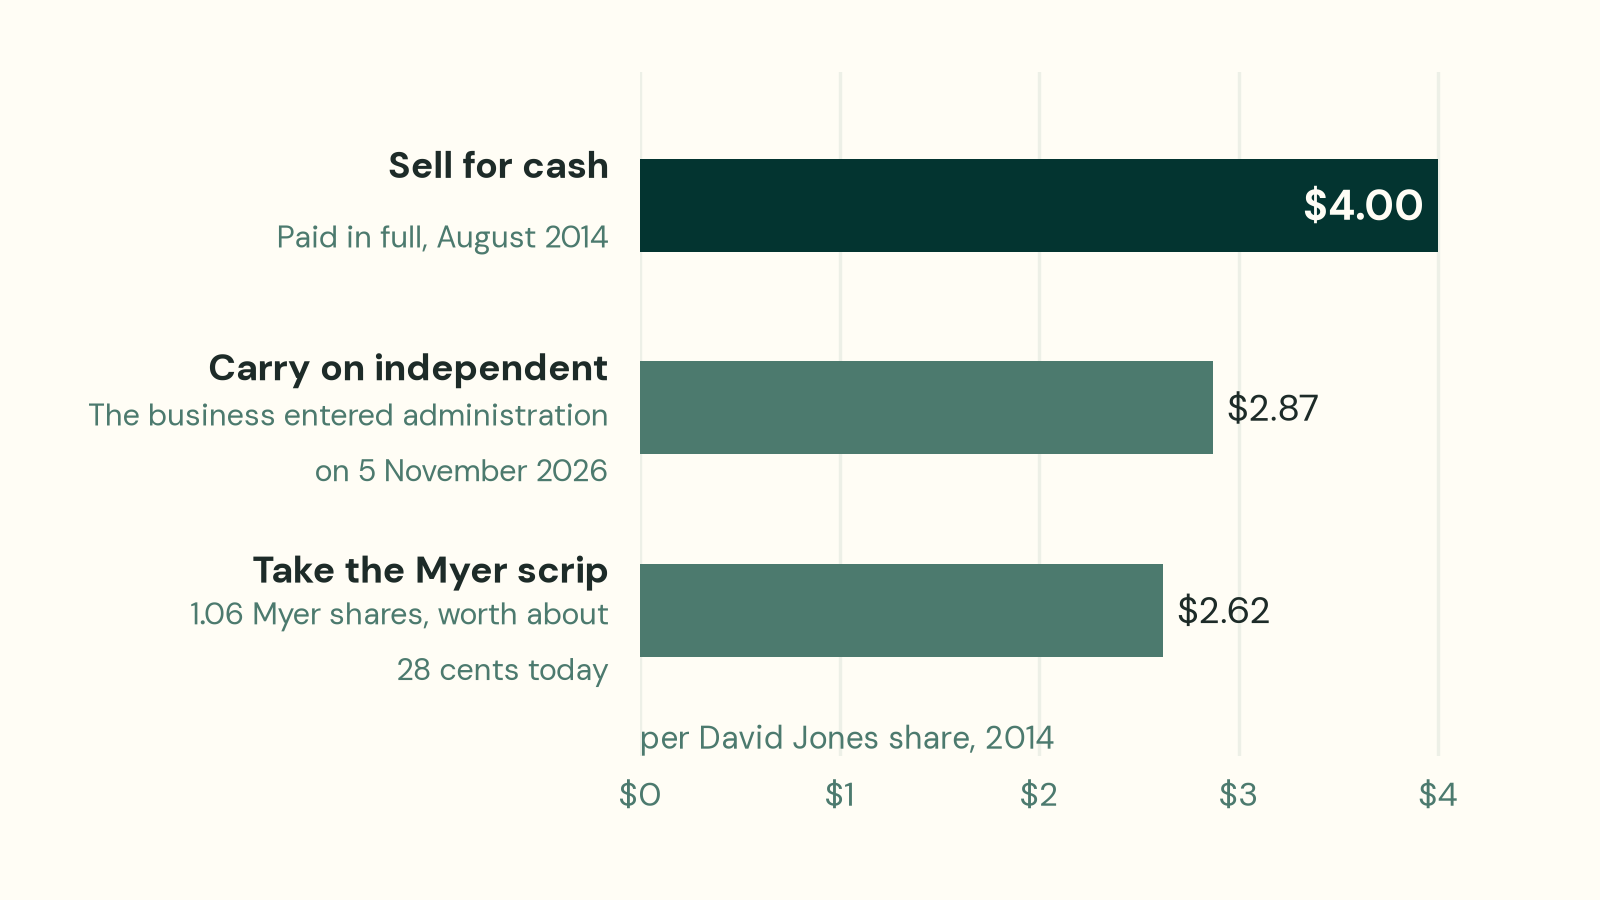
The three options in front of the David Jones board in 2014, valued per David Jones share at the time. Figures from the scheme booklet of 23 May 2014 and the ASX announcements it refers to. The independent option is valued at the undisturbed price of 30 January 2014. Myer's share price is quoted without dividends, which a holder would also have received. Past outcomes are not a guide to future outcomes.
There was an independent expert's report, as there always is, and it found the price fair. We would not lean on it, and nor should anyone else: those reports are commissioned by a board that has usually already made up its mind, and they rarely trouble it. The better test is what the other two options turned out to be worth.
Option 1 — accept $4.00, or remain independent?
It is impossible to know how David Jones might have performed over the past 12 years as an independent listed company, potentially under a different management team and board.
What we do know is that the business has now entered administration.
Following its acquisition, Woolworths Holdings impaired the investment across 2018 and 2019 — writing off roughly R13 billion of the R21.5 billion it had paid, which left David Jones carried at about $965 million — and in March 2023 sold the business to Anchorage Capital Partners for just $100 million.
While Woolworths may have received some capital distributions during its ownership, the impairments and subsequent sale demonstrate the substantial destruction of value relative to its original $2.149 billion investment. Anchorage, in turn, appears to have lost its equity investment following the business's eventual collapse.
In just 12 years, the value attributed to David Jones declined from more than $2 billion (approximately $3 billion in today's money) to effectively nil.
Option 2 — the Myer alternative
The Myer scrip alternative is more straightforward to assess.
The 1.06 Myer shares that David Jones shareholders would have received are now worth approximately 28 cents per original David Jones share, implying a total value of around $148 million for the business. In 2014 dollars, that equates to approximately $105 million — a decline of around 95% against the $4.00 per share Woolworths paid in cash.
The conclusion is stark. By accepting the Woolworths offer, David Jones shareholders received $4.00 per share in cash and exited the investment. Had they instead pursued the Myer merger or remained invested in David Jones, the eventual outcome would have been dramatically worse: on the comparisons above, the value of their investment would have fallen by approximately 95% to 100%.
The board's decision to recommend the Woolworths offer proved to be an exceptionally important capital allocation decision for David Jones shareholders.
As Brad Soller, who was involved in the transaction, reflected:
"The Board had a clear view of the underlying value of the company and based its recommendation on that assessment. With the benefit of hindsight, it was clearly the right decision."
The chart below shows the value attributed to David Jones by its successive owners.
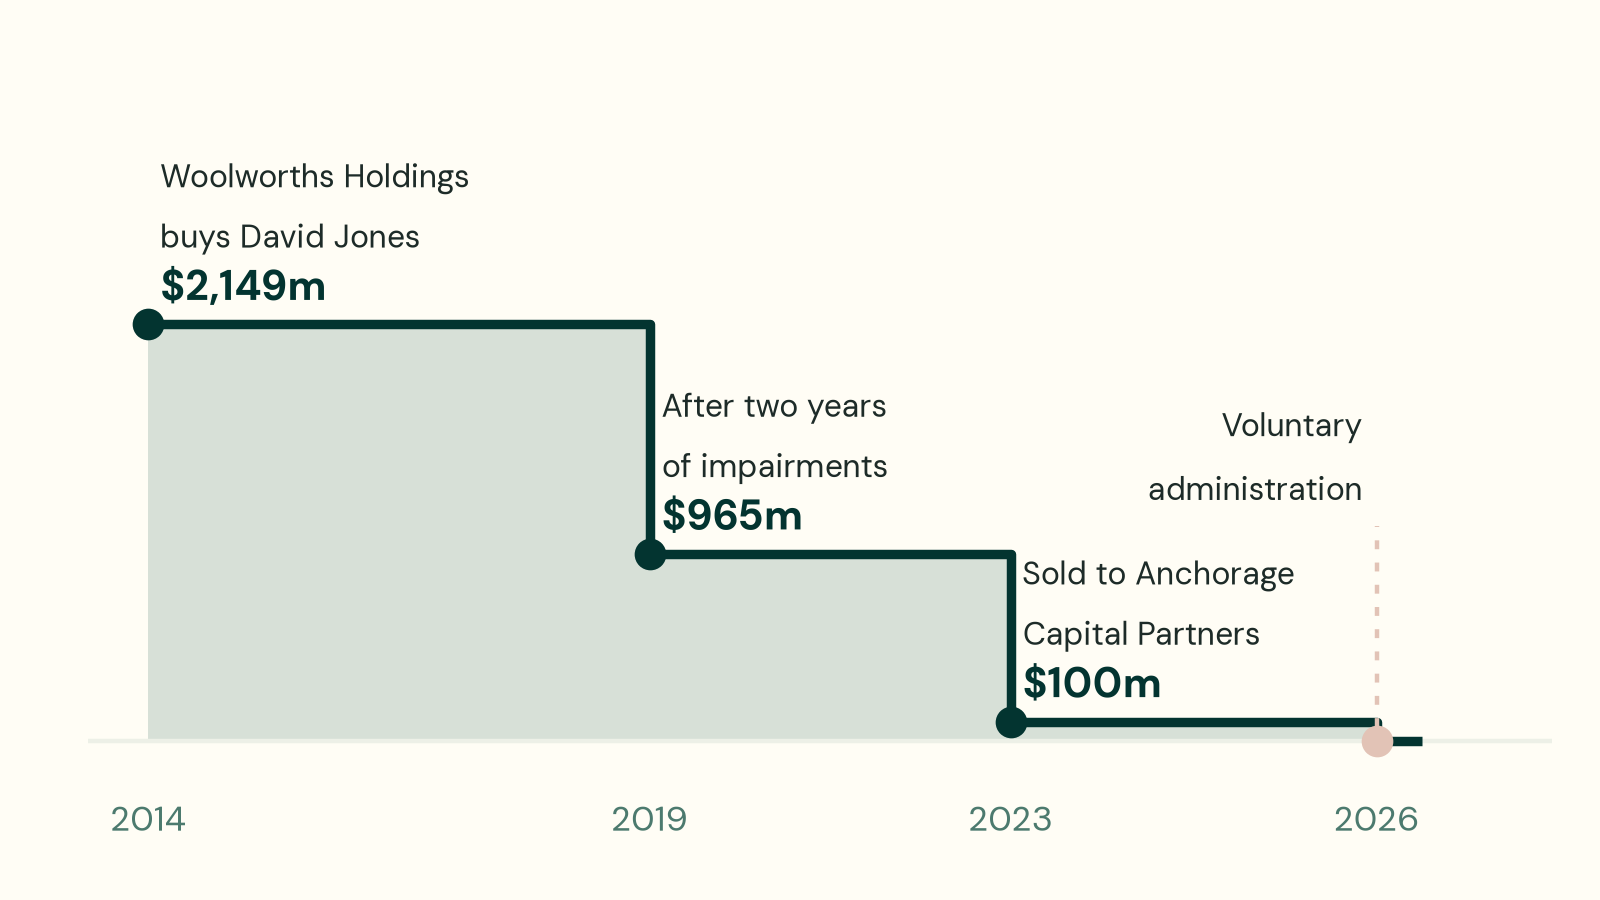
What David Jones has been worth to its successive owners. Impairments are Woolworths Holdings' own reported figures, converted at the exchange rates prevailing when they were recognised. The 2021 sale of the Elizabeth Street flagship property is excluded, as it was sold separately and was not part of the trading business. Past outcomes are not a guide to future outcomes.
Metcash — a different example of capital allocation
Following the David Jones transaction, Brad joined Metcash as chief financial officer in February 2015.
Within months of his arrival, Metcash agreed to sell its automotive parts division to Burson Group (now Bapcor) for $275 million. That amount is equivalent to approximately $380 million in today's dollars. For context, Bapcor's current market value, excluding the $200 million of fresh equity raised from shareholders in February, is approximately $370 million for the entire group.
In October 2016, Metcash acquired Home Timber & Hardware from Woolworths Australia for $165 million.
The acquisition provided Metcash with an opportunity to materially expand its position in the hardware market, with significant potential for operational improvements and synergies. Hardware division earnings increased from $33 million in the year before the acquisition to $112 million in FY21, with a substantial proportion of that growth attributable to the acquisition and the benefits of combining the businesses. Including Total Tools, bought that same year, the segment earned $136 million in FY21.
In 2020, Metcash made a further strategic investment, acquiring 70% of Total Tools for approximately $57 million, struck on normalised earnings before interest, tax, depreciation and amortisation of $12.6 million.
Total Tools generated $79 million of EBIT last year. The acquisition also included put options over the remaining 30%, which influenced the overall economics of the transaction. Accordingly, the initial purchase price alone does not provide a complete basis for assessing the investment.
As illustrated in the chart below, the acquisitions of Home Timber & Hardware and Total Tools were key drivers of the Hardware and Tools division's growth. Network sales increased by approximately 120%, while earnings grew at a compound annual rate of around 17%.
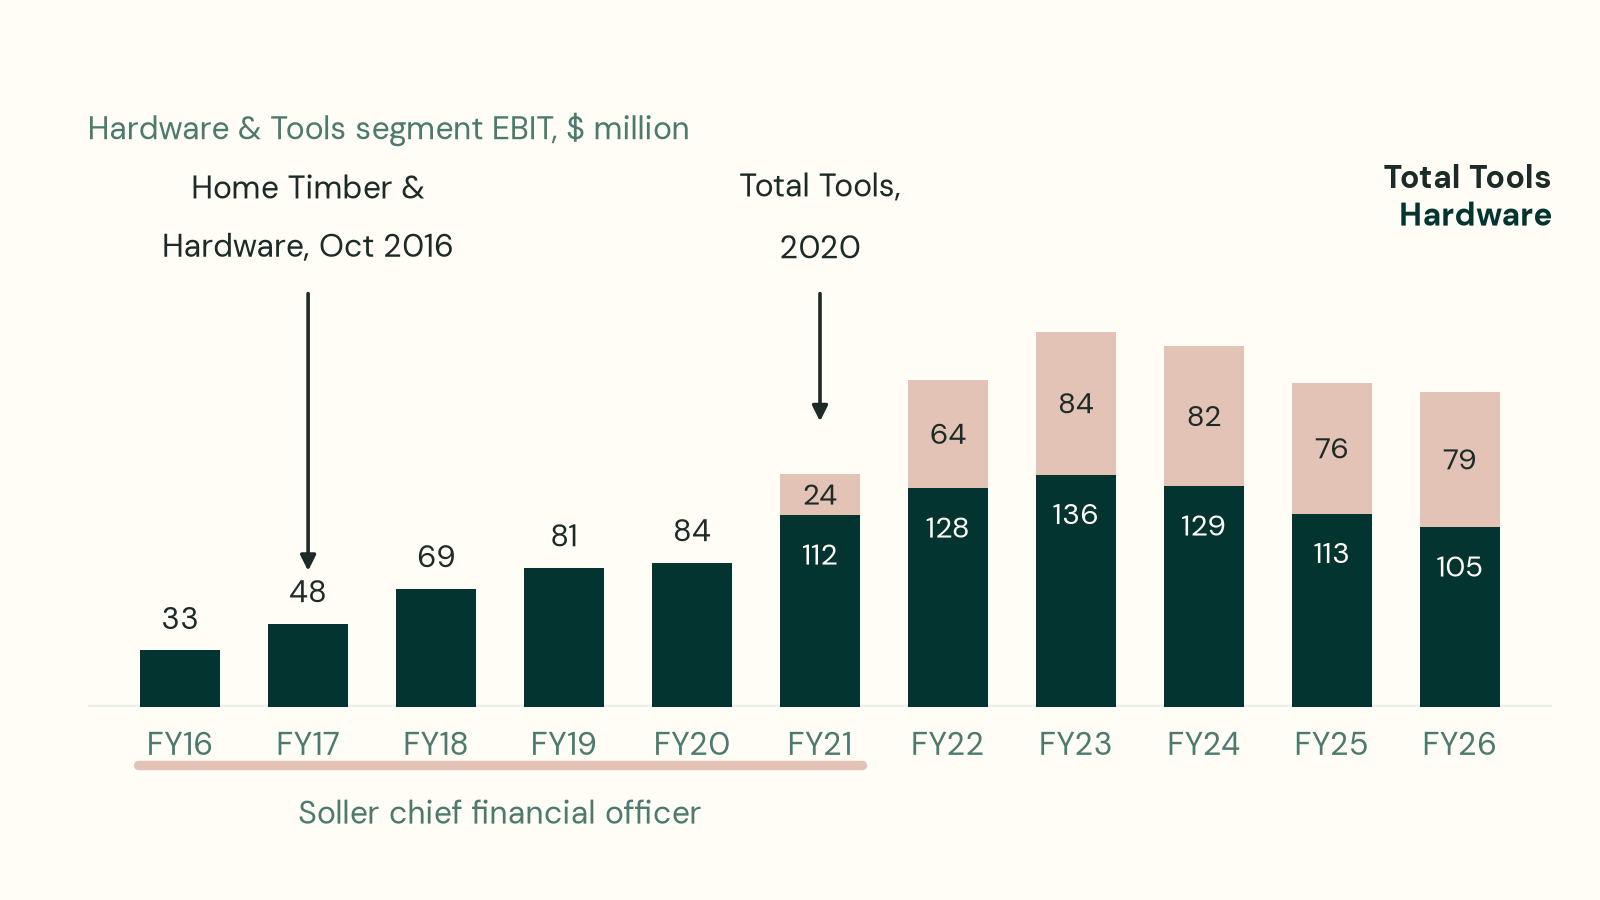
Source: Metcash annual reports and full-year segment disclosures, FY16 to FY26. Metcash's financial year ends on 30 April. Home Timber & Hardware was acquired in FY17 and Total Tools in FY21. Earnings are normalised, which explains why FY26 segment earnings total $184.2 million compared with reported EBIT of $177.3 million. Past earnings are not a guide to future earnings.
Segment earnings have fallen in each of the last three years, from the FY23 peak of $219.2 million to $177.3 million in FY26, as housing construction slowed.
Importantly, these investments also helped diversify Metcash's earnings base. Hardware's contribution to group earnings increased from approximately 2.9% to 10%.
Brad reflected on the acquisitions:
"Metcash recognised the opportunity to grow its position in the hardware sector. Both Home Timber & Hardware and Total Tools presented attractive opportunities to expand the business and create value through significant synergies. The acquisitions were not only well priced but were also executed effectively by the Hardware management team."
Why he is at our table
We are humble enough to admit that we have made serious errors assessing which boards and management teams are good at allocating capital. That is one of the reasons we appointed an Advisory Board: three people with decades of operating and investing experience who help us judge management and governance when we look at an investment, and who shape how we engage with the companies we own. They also review our letters to boards before we send them, and every position above half its target weight is presented to them before we complete it.
Brad is a rarity. Most of the capital allocation we watch is somewhere between careless and value-destroying, which is precisely why the people who are good at it are worth having in the room when we are forming a view about someone else's board.
Twelve years after that $4.00, the business David Jones used to be is in the hands of administrators. The shareholders were out long ago, with cash — and had that $4.00 gone into the S&P/ASX 200 Accumulation Index instead, it would be worth about $10.25 today. Somebody made that happen.
Merlon's funds held Metcash at 31 October 2026 — 1.80% of the Concentrated Australian Share Fund and 1.21% of the Australian Share Income Fund, net of that fund's option hedging. Brad Soller was Metcash's chief financial officer from 2015 to 2020 and is a remunerated member of Merlon's Advisory Board. Merlon held Metcash before that board was formed, and Metcash was discussed at its first meeting in November 2024, which he attended. The Advisory Board advises; it does not make Merlon's investment decisions.
