
Quality in the Merlon Process
Quality alone does not drive good investment outcomes: Last quarter (Good companies are not always good investments), we highlighted that there is little evidence that “quality” factors outperform over a full market cycle.
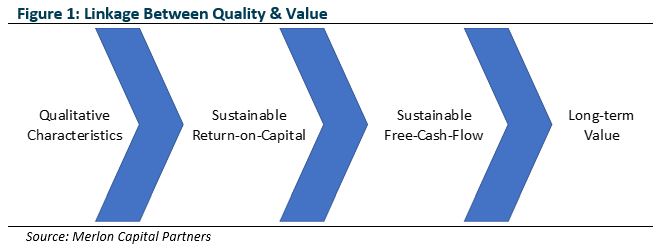
Qualitative characteristics drive sustainable returns on capital: At Merlon we do not “screen” on quality but seek to ensure our estimates of sustainable return on capital appropriately reflect qualitative characteristics. Within our qualitative framework we explicitly rate (i) industry structure; (ii) competitive advantage; and, (iii) governance and management. We are sceptical about the sustainability of high returns if our qualitative assessment is poor and vice-versa.
Sustainable returns on capital drive sustainable-free-cash-flow: Companies with sustainably high returns on capital ultimately throw off more free-cash-flow. For example, a company with a 5% sustainable return on capital will not generate any sustainable-free-cash flow if it is seeking to grow its business at the same rate. This must be the case because the company will need to expand its capital asset base by 5% per year which will require it to retain 100% of its cash earnings.
Sustainable-free-cash-flow drives our assessment of value: At Merlon we value companies based on our assessments of sustainable-free-cash-flow. What matters to us is not simply the quality of the business but the price paid relative to the quantum of sustainable-free-cash-flow received.
Valuation upside is a necessary but insufficient investment criterion: To be a good investment, we need to understand why the stock is mispriced, have an explicit view to the contrary and we need to understand whether expected returns are acceptable relative to the risk of capital loss.
Merlon’s Investment Philosophy and Process
At Merlon we believe stocks trading below fair value will outperform through time. We value companies based on a long-term view of their sustainable free cash-flow on a debt-free basis. We also believe stocks don’t outperform merely because they are undervalued but rather because the market’s concerns are either invalid or priced in, and Merlon analysts ascribe a conviction score to reflect this.
Investing in companies that have a history of strong free cash flow relative to the stock price has been shown to lead to outperformance over time.
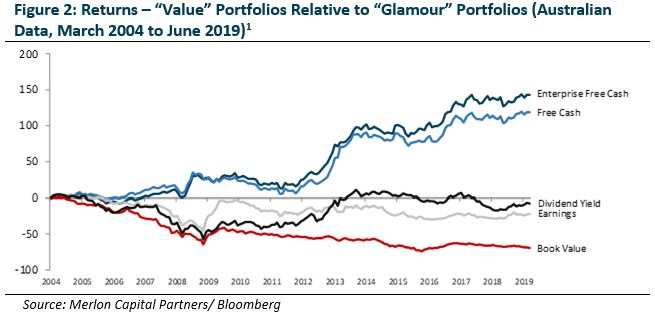
We have written several papers (Value Investing Part 1, Part II & Part III) explaining why free cash flow as a value factor has consistently outperformed on a risk adjusted basis. One theory we discussed is the correlation between free cash flow and the accruals factor, that is a company’s advertised earnings are of higher quality when supported by free cash-flow. Conversely, when there is a large gap between accounting earnings and free cash-flow, this either reflects a low return on capital business or potential overstatement of accounting earnings, or both.
How Quality Integrates into the Merlon Process
Quality has an integral role in both the valuation and conviction aspects of Merlon’s investment philosophy and process. Rather than using quality as a “screen” to knock in or knock out investment ideas, it assists in determining and calibrating our two key research outputs:
- Valuation: based on the capitalisation of sustainable-free-cash-flow and franking credits;
- Conviction: premised around our philosophical belief that stocks are rarely under or over-valued without good reason. To be a good investment, we need to understand why the stock is mispriced and we need to have an explicit view to the contrary. Our analysts reflect this in a numerical score between 1 and 4.
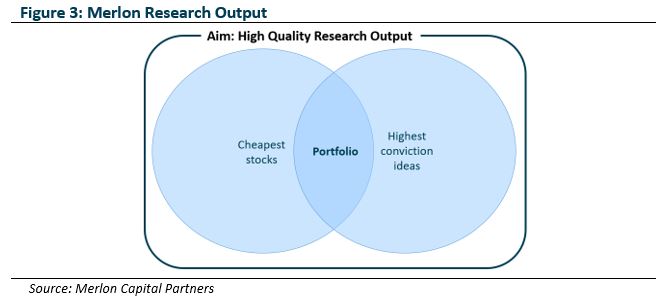
Our conviction scores and our fundamental valuations determine our portfolio weights, subject to risk and liquidity constraints.
Merlon Valuations and the Role of Quality
As mentioned, we do not screen on quality but seek to ensure our estimates of sustainable free cash flow for companies appropriately reflect qualitative characteristics. These estimates of sustainable free cash flow, in turn, drive our assessment of fundamental value.
Ultimately, we don’t believe that excessive margins or returns on capital can be sustained unless they are supported by a combination of qualitative measures that we assess for each company:
1. Industry structure
Industry structure is analysed at a business segment level according to the widely used framework developed by Michael Porter. Porter’s Five Forces views industry profitability as determined by five external forces: availability of substitutes, barriers to entry, competitive rivalry, and bargaining power of customers and suppliers.For example, we view the duopoly industry structure of the Australian supermarkets, Coles and Woolworths, as markedly strong. While there are market concerns around the competitive threats of Aldi and other overseas players, ultimately the scale benefits and dominant market positions of Coles and Woolworths reinforce the sustainability of their free cash flow.
2. Competitive advantage
Competitive advantage is determined with reference to scale or cost advantage, product differentiation and customer intimacy or loyalty. This widely-adopted framework was developed by Michael Treacy and Fred Wiersma in their book “The Discipline of Market leaders”. The main premise is that companies must achieve market leadership in one of three disciplines and perform to an acceptable level in the other two.Our assessment of relevant Environmental and Social factors within ESG considerations is incorporated within the relevant competitive advantage. For example, Asaleo’s use of sustainably sourced pulp is a positive differentiator when competing for supermarket private label contracts compared to their competitors’ inferior sustainable sourcing standards.
3. Governance and Management
Governance and Management is decomposed into Governance; Capital Allocation; and Execution.We place extra weight on the Governance factor due to its significant influence on capital allocation and management behaviour. Merlon proactively meets with board members of companies in our portfolio and strongly advocates for optimal shareholder outcomes in the face of poor governance e.g. AMP’s poor divestment of its Life Insurance business.
We described in some detail how our management score as a proxy for capital misallocation risk impacts both valuation and conviction when analysing the value destruction of CBA’s Colonial acquisition in 2000 and Boral’s overpriced acquisition of Headwaters in 2016.
We maintain and update quality scores on our covered stock universe and rigorously debate these before considering financial projections of sustainable free cash flow and assessing key issues for a stock.
Overall, Merlon’s proprietary quality scores have proven effective in differentiating high quality from low quality.
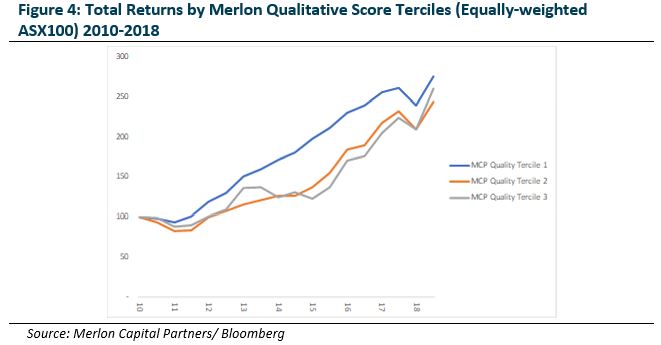
However, we would caution that the period since Merlon’s inception has been defined by historically low and declining interest rates. As per our earlier analysis Good companies are not always good investments, we remain mindful that valuations for quality stocks remain above historic norms. This potential “bubble” in quality stocks increases the importance of long-term fundamental valuation for investors.
Earnings Quality
“Earnings quality” is conspicuously absent from our qualitative scorecard. This is not because we don’t think earnings quality is important but rather because we value companies on the basis of sustainable-free-cash-flow rather than accounting earnings.
The ultimate test of earnings quality is the ratio of sustainable-free-cash-flow to accounting profits and sustainable-free-cash-flow is the basis upon which we value businesses.
Balance Sheet Strength
Also absent from our qualitative scorecard is “Balance Sheet Strength”. Once again, this is not because we don’t think balance sheet strength is important but rather because we integrate balance sheet leverage within our valuation framework.
Merlon’s sustainable-free-cash-flow based valuations are calculated on an enterprise value basis with the equity value determined after fully deducting net debt. Additionally, higher financial leverage would impact the sensitivity of our valuation scenarios creating a wider range of outcomes.
The ultimate test of balance sheet strength is the value of the equity after debt and other financial obligations have been met in full. This is the basis upon which we value companies.
Merlon Conviction Scores and the role of quality
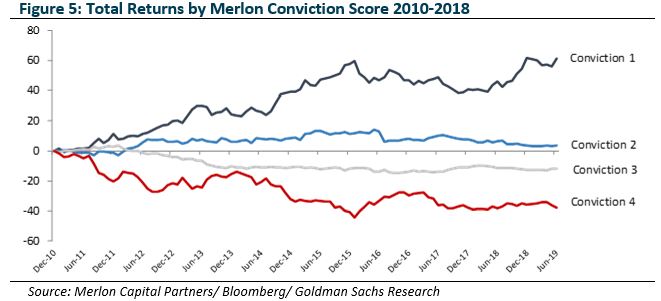
Alongside valuation, we assign a Conviction Score to each stock we cover reflecting the degree to which we think there is misperception in the market. Since our inception in 2010, Merlon’s conviction scores have demonstrated the value-add from having differentiated, contrarian views.
In determining conviction, we need to assess whether our view on quality, whether it be industry structure, competitive positioning or management, is different to the market based on evidence. For example, we had high conviction on Woolworths when the market believed the industry structure had materially deteriorated, rather attributing the decline to poor management execution that could be corrected. With Transurban, we agree the company is very high quality (monopoly) but this view is no different to the market, leading to a lower conviction score.
Determining business segment quality and the Bear Case
It is also important to conduct any quality assessment at a business segment level, rather than at a group level, as the market often over-emphasises a low-quality segment at the expense of a high quality one.
Our observation is that many listed companies in Australia have one or two very strong businesses operating under umbrellas of favourable industry structures held alongside some very poor businesses acquired or grown by weak boards and management that at some point misattributed the success of their core businesses to their own abilities rather than their privileged market positions.
A key aspect in determining conviction is producing a valuation range based on sustainable-free-cash-flow scenarios, with a higher conviction score ascribed when the share price is trading close to or below our bear/worst case scenario.
The Merlon quality score, at a business segment level, is a critical consideration in determining the bear case. Numerous examples of market misperception due to negativity around a segment have provided opportunities in the past:
- Fairfax’s share price traded below our bear case which was fully underwritten by the higher quality digital classified business with the lower quality traditional print business valued at zero;
- The same can be said for ANZ’s higher quality domestic franchise when the lower quality offshore franchise was causing problems;
- BlueScope Steel’s high quality Colorbond distribution business was obscured by the loss-making commodity steel export business;
- Suncorp’s higher quality general insurance business when the “bad bank” was generating credit losses during the Global Financial Crisis;
- Asaleo Care’s strong personal care brands (Libra, Tena) concealed by its loss-making consumer tissue business.
Conclusion
“There’s good assets and bad assets but good prices and bad prices supersede whether the assets are good or bad”
– David Abrams
As previously discussed in Good companies are not always good investments, there is little evidence that “quality” factors outperform over a full market cycle. Understanding and measuring “quality” is better used as tool for calibrating the estimate of sustainable free cash flow. We believe that consistently paying a low price relative to a company’s sustainable free cash flow is vastly more important than the “feel good” factor of owning quality companies.
Understanding and measuring “quality” is also better used as a tool for determining downside valuation scenarios to limit investment losses in the event the market concerns prove to be valid. We place a heavy emphasis on downside risk and have had many investment successes when the market has overlooked a good quality segment with strong and sustainable cash flows because of concerns over a lower quality segment that could be quarantined.
The manipulation of accounting earnings now more than ever highlights the importance of a free cash flow track record as the key metric to measure the quality of the underlying business.
At Merlon, we believe that by consistently paying a low price for a range of reasonable scenarios (measured by free cash flow) will lead to investment outperformance. What matters is the price paid relative to the quantum of cash flow received – which in turn is more sustainable for businesses with better qualitative features.
Author: Joey Mui, Portfolio Manager/Analyst
[1] Portfolios are formed using four valuation ratios: free-cash-flow-to-price (F/P); enterprise-free-cash-flow (EF/EV); earnings-to-price (E/P) and book value-to market (B/M). Portfolios are formed at the end of each month by sorting on one of the four ratios and then computing equally-weighted returns for the following month. The “value” portfolios contain firms in the top one third of a ratio and the “glamour” portfolios contain firms in the bottom third. The analysis is based on S&P/ASX200 constituents and the raw data is from Bloomberg.
The information in this article is current as at the date of publication and is provided by Merlon Capital Partners Pty Limited ABN 94 140 833 683 AFSL 343 753 (Merlon), the investment manager of the Merlon Australian Share Income Fund ARSN 090 578 171 (Fund) . The information is intended solely for holders of an Australian Financial Services Licence, institutional or other wholesale clients. It is intended to be general information only and not financial product advice and has been prepared without taking into account your objectives, financial situation or needs. You should consider the applicable disclosure document or product disclosure statement (PDS) and any additional information booklet for the Fund before deciding whether to acquire or continue to hold an interest in the Fund. These documents can be obtained from your financial adviser, our Investor Services team on 13 51 53, or on www.fidante.com.au. Past performance is not a reliable indicator of future performance. Neither your investment nor any particular rate of return is guaranteed. Fidante Partners Limited ABN 94 002 835 592 AFSL 234668 (Fidante Partners), is the responsible entity of the Fund. Other than information which is identified as sourced from Fidante Partners in relation to the Fund, Fidante Partners is not responsible for the information in this publication, including any statements of opinion. The information is not intended to be relied upon as a forecast or research and is not a recommendation, offer or solicitation to buy or sell any securities or to adopt any investment strategy, nor is it investment advice. Neither of Fidante Partners nor Merlon Capital Partners Pty Limited makes any representation or warranty as to the accuracy of the data, forward‐looking statements or other information in this material and shall have any liability for any decisions or actions based on this material. Neither of Fidante Partners nor Merlon Capital Partners Pty Limited undertakes, and is under any obligation, to update or keep current the information or opinions contained in this material. The information and opinions contained in this material are derived from proprietary and non‐proprietary sources considered by Fidante Partners or Merlon Capital Partners Pty Limited (as applicable) to be reliable but may not necessarily be all‐inclusive and are not guaranteed to be accurate.